Watchflare: Self-hosted server monitoring
Open-source, self-hosted server monitoring. Lightweight agents report metrics and package inventory to the Hub over gRPC/TLS, with real-time dashboards and alerts.
Watchflare is a self-hosted platform that monitors your hosts and tracks their software. It collects system metrics in real time (CPU, memory, disk, network, and temperatures) and maintains a full package inventory across your hosts: installed versions, daily change history, and available updates.
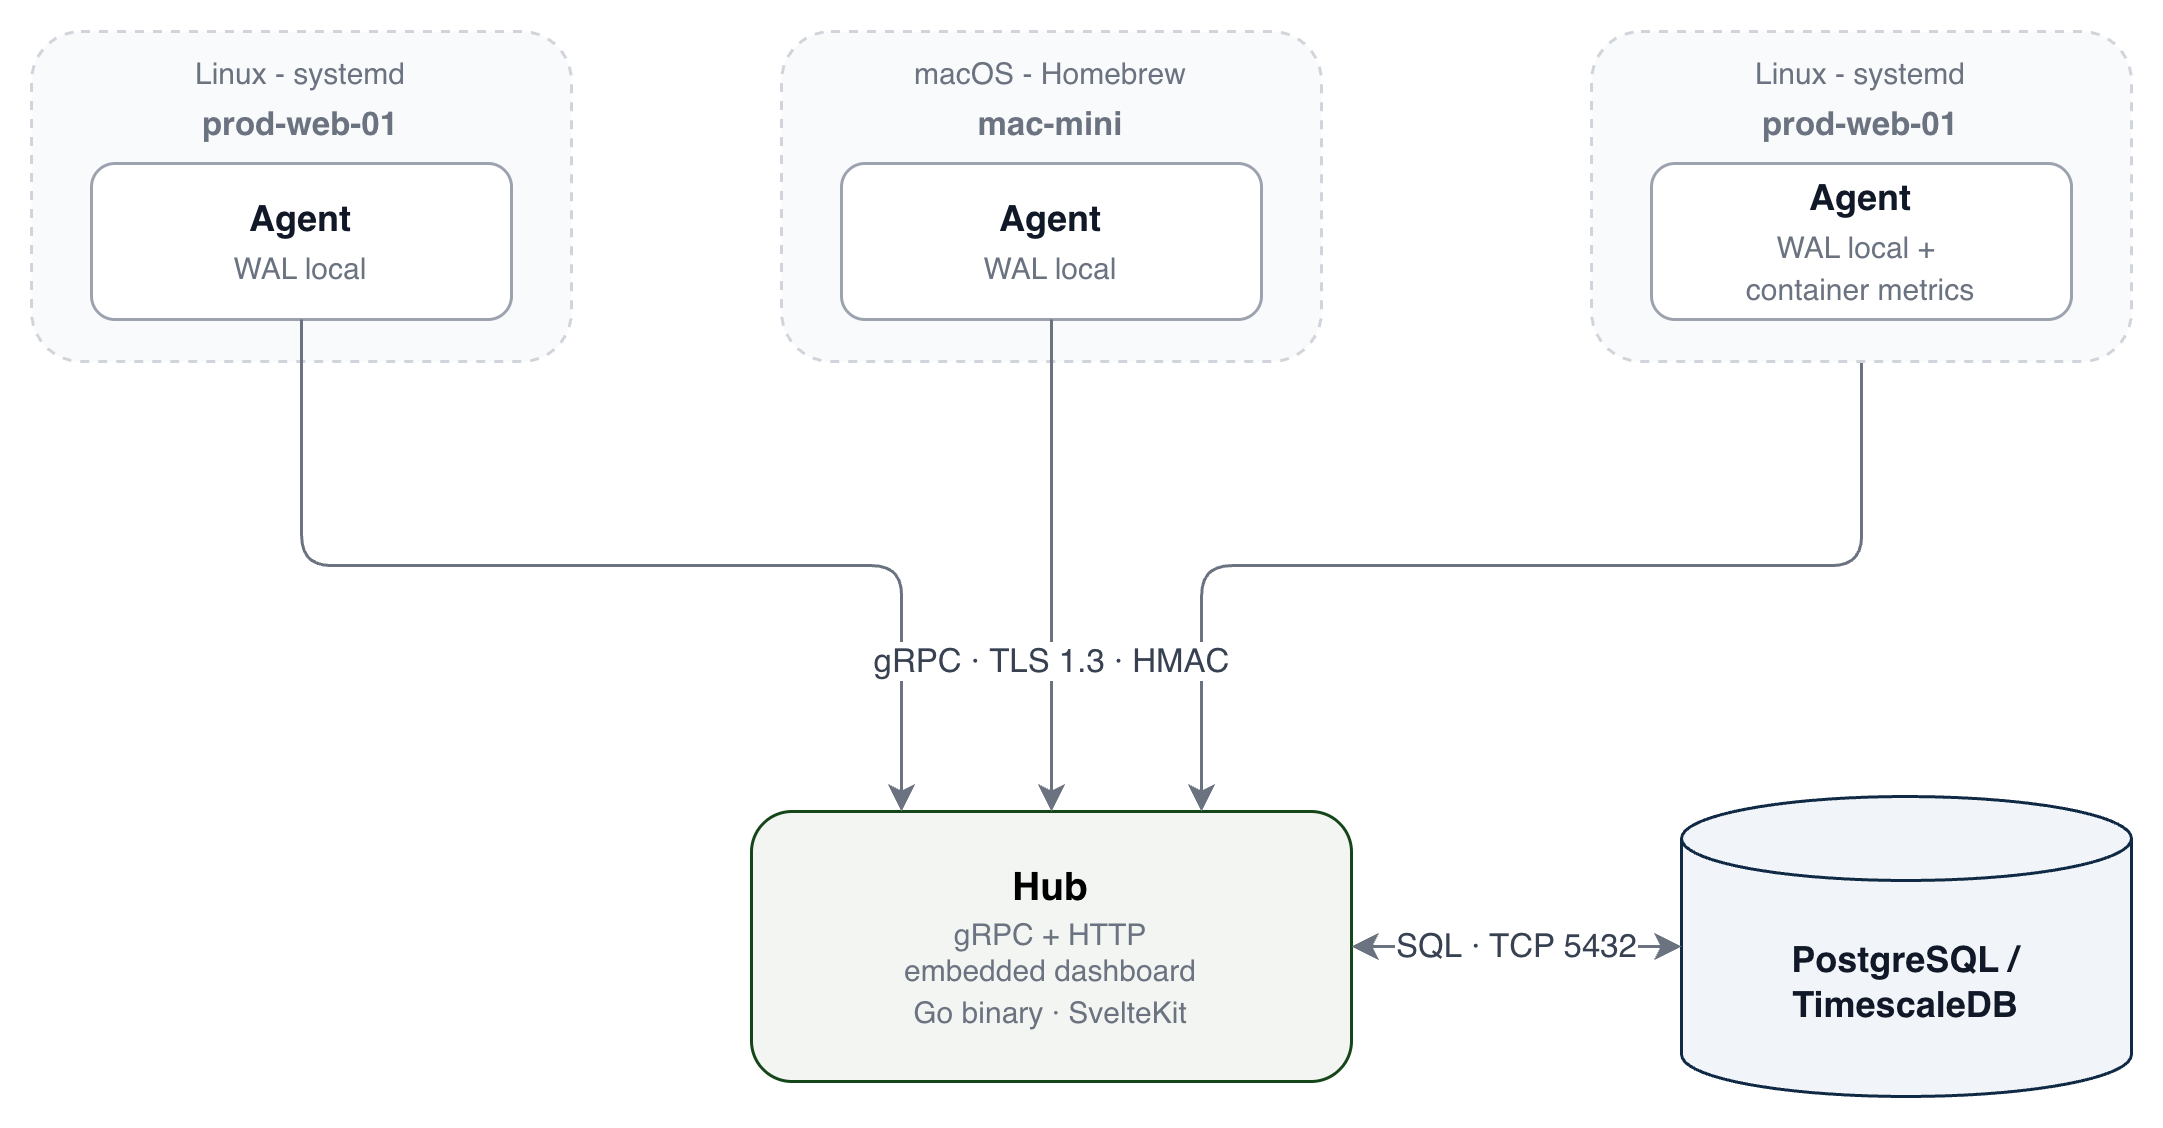
Two components
Watchflare is made of two pieces that work together:
Hub is the central server. Deploy it once with Docker Compose or as a native Linux binary. It receives data from agents, stores it in a time-series database, and serves the web dashboard. The Hub is a single binary with the frontend embedded.
Agent is a lightweight daemon that runs on each host you want to monitor. It supports Linux and macOS, with Windows support planned. It collects system metrics every 30 seconds, sends a heartbeat every 5 seconds, and builds a daily package inventory. The agent uses minimal resources and never needs root to run. On Linux it runs as a dedicated watchflare system user, and on macOS it runs under your own account via Homebrew.
What it monitors
| Category | Metrics |
|---|---|
| CPU | Usage %, iowait, steal (VMs) |
| Memory | Used, available, buffers, cached, swap |
| Disk | Total, used, read/write throughput |
| Network | Inbound/outbound bandwidth |
| Temperature | CPU and other temperature sensors (storage, power management, etc.) on physical hosts |
| System | Uptime, load average (1/5/15 min), process count |
| Containers | Per-container CPU, memory, network (Docker/Podman, opt-in) |
| Services | systemd unit inventory and live state on Linux hosts |
| Packages | Installed packages, versions, and outdated detection across ~30 supported package managers |
What you get
- Real-time dashboard. Host online/offline status updates within seconds via Server-Sent Events. Live metrics stream straight to the dashboard as agents report them. No polling, no page refresh.
- Historical charts. Metrics stored in TimescaleDB with automatic aggregation. View 1h, 12h, 24h, 7d, and 30d time ranges.
- Package inventory. Full list of installed packages on every host, updated daily, with change history and outdated package detection.
- Alerts. Threshold-based alerts on CPU, memory, disk, load, and temperature, plus host-offline notifications. Delivered by email and to any of the 26+ notification channels supported by Shoutrrr (Discord, Slack, Telegram, Matrix, Ntfy, Gotify, generic HTTP, and more).
- Write-ahead log. If the Hub is unreachable, the agent buffers metrics locally and replays them on reconnect. Metrics are not lost during brief outages: the WAL holds up to 10 MB by default (configurable via
wal_max_size_mb).
Self-hosted, by design
Watchflare runs entirely on your infrastructure. The Hub and its database live on a server you control. Agents communicate only with your Hub: no usage tracking, no telemetry.
Note
Ready to get started? The Quickstart has you up and running in under 5 minutes.